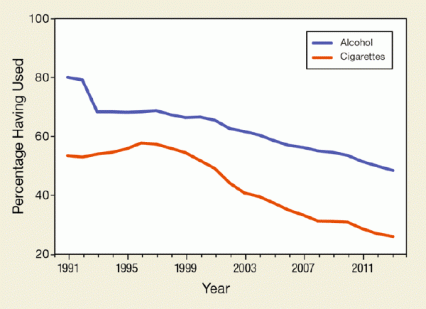
For the 16th year in a row, NIDA’s annual Monitoring the Future (MTF) survey has documented a decline in the percentage of American students in grades 8, 10, and 12 who report having ever used alcohol. The percentage of survey respondents who reported having ever smoked cigarettes also dropped, for the 17th straight year, bringing lifetime smoking prevalence among these teens to less than half of the peak reported in the mid-1990s (see Figure 1). However, the portion of students reporting that they had used an illegal drug during their lifetime increased by 1.7 percentage points, from 34.1 percent in 2012 to 35.8 percent in 2013.
 Figure 1. Adolescents’ Use of Alcohol and Cigarettes at Lowest Levels Ever Recorded Use of alcohol and cigarettes among students in grades 8, 10, and 12 has shown a continuous decline for more than 15 years. In the 2013 survey, 48 percent and 26 percent of the students reported use of alcohol and cigarettes, respectively, during their lifetime, down from 80 percent for alcohol and nearly 60 percent for tobacco in the early to mid-1990s.
- Text description of Figure 1
-
The graph shows combined data for high school students in grades 8, 10, and 12 indicating the proportions (as percentages) of students who, during surveys done between 1991 and 2013, reported using alcohol or cigarettes at one point in their lives. The vertical (y)-axis shows the percentage of students and the horizontal (x)-axis the year in which lifetime alcohol or cigarette use was recorded. As shown by the blue line, the proportion of students reporting that they had used alcohol during their lifetime declined from more than 80 percent in 1991 to 48 percent in 2013, the result of a robust 16-year downward trend. As shown by the orange line, cigarette use showed an accelerating decrease from a peak level of 58 percent in 1996 to 26 percent in 2013.
Marijuana: Rising Use and Falling Risk Perception
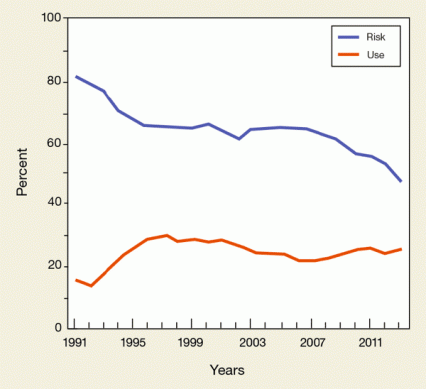
 Figure 2. While the Perceived Risk of Marijuana Continues To Fall Among Middle and High School Students, Their Use of Marijuana Is Rising The perceived risk of marijuana use among students in grades 8, 10, and 12 showed a continuous decline, while reported marijuana use showed a slow but unremitting increase from 2006 onward. The lines show percentages of students reporting marijuana use and perceiving the drug as a risk and represent averages for the three grades; students attended public and private schools in the continental United States and were asked about the harmfulness and their use of various drugs in annual surveys.
- Text description of Figure 2
-
The graph shows combined data for high school students in grades 8, 10, and 12 indicating the proportion (as percentage) of students who reported using marijuana or perceived its use as a risk in a given year. The vertical (y)-axis shows the percentage of students, and the horizontal (x)-axis the year in which marijuana use or risk perception were recorded. As shown by the blue line, the proportion of students reporting that they perceived marijuana use as a risk declined from more than 80 percent in 1991 to about 50 percent in 2013. The trend was largely unbroken during this 21-year period and showed a somewhat steeper drop from about 60 percent to 50 percent over the last 5 years recorded. As shown by the orange line, marijuana use showed a steady increase from around 15 percent in 1992 to about 30 percent in 1997, showed a slow decline to just above 20 percent in 2007, and moderate increase since then to about 25 percent in 2013. The relative trajectories of the two curves suggest that declines in the perception of risk of marijuana use (for example, between 1991 and 1996) slightly preceded increases of its use (for example, between 1992 and 1997) among the students during the monitored period.
As in years past, marijuana was the most frequently used illegal drug, and the one that determined the overall trend in illegal drug use. Almost one-third (32 percent) of the roughly 42,000 survey respondents reported having used the drug during their lifetime. The prevalence of past-year use of marijuana among the students has risen by 16.7 percent, from 21.5 percent to 25.8 percent, over the past 5 years. Some 3.7 percent of the students reported daily use of marijuana in 2013, on par with the highest recorded daily use during 22 years of monitoring. Moreover, the survey exposed a concerning trend of students perceiving marijuana as less dangerous than they have in previous years (see Figure 2).
Dr. Lloyd Johnston, the principal investigator of MTF and Angus Campbell Collegiate Research Professor at the University of Michigan, says the students’ lower estimation of the risks of marijuana use could herald impending further increases in use of the drug: “We’ve seen in various historical periods a strong correlation between changes in perceived risk and use of various drugs,” Dr. Johnston says. “We don’t have many leading indicators in the social sciences, so we take this correlation seriously.”
Echoing Dr. Johnston’s observations, NIDA Director Dr. Nora D. Volkow stresses the particular danger that marijuana use poses to the adolescent brain: “Marijuana use is of great concern because the cannabinoid receptors that are stimulated by this drug are intimately involved with the development and connectivity of the brain,” she says. “Interfering with these processes could result in potentially deleterious changes in the way a user’s brain functions during adulthood.” Dr. Volkow notes that marijuana is currently the number 1 drug for which adolescents seek treatment.
The general relaxation of social opposition to marijuana use, and legalization of the drug in some states, may be affecting students’ risk perception and access to the drug. More than one-third of marijuana-using high school seniors in states where the drug is legal said that they obtained marijuana through someone else’s prescription.
Dr. Volkow advises clinicians to screen for marijuana use and consider the drug’s potential effects when they assess and treat patients: “Our health care system hasn’t been paying attention to this. How does marijuana interact with other medications that may be used? What is the prevalence of use during pregnancy? We have little information to answer these questions.”
Brighter News on Other Drugs
The portions of survey respondents who reported using cocaine, methamphetamine, or heroin during the past year all fell nonsignificantly; at 0.6 percent (heroin) to 1.8 percent (cocaine), each was at the nadir of a decade-long downward trend. Although Monitoring the Future has tracked nonmedical use of prescription stimulants and opioids for fewer years, students’ overall past-year and lifetime prevalence of such use were also at all-time lows for the survey. In the case of the prescription opioid Vicodin, a significant drop in past-year prevalence of use among 12th graders, from 7.5 percent to 5.3 percent, offset slight upward trends among 8th and 10th graders.
The students who responded to the 2013 MTF reported lower use of several drugs that pose serious health concerns, including:
- Synthetic marijuana (“K2” or “Spice”): Because this group of drugs has entered the market relatively recently, MTF began to fully monitor the use of these drugs only in the last 2 years. The data suggest a decline in prevalence of synthetic cannabinoid use in all age groups, with a highly significant drop among 12th graders, from 11.3 percent in 2012 to 7.9 percent in 2013.
- Bath salts: Reports of significant use and dangerous adverse reactions to these synthetic stimulants prompted their inclusion in MTF in 2012. The movement in prevalence of past-year use was nonsignificant and mixed in the grades—upward in 8th and 10th grade and downward in 12th grade. However, the percentages of students who said these drugs are potentially harmful increased substantially in all three grades, by increments ranging from 13.2 percentage points among 8th graders to 24.9 percentage points among 12th graders, and reached almost 70 percent among the 12th graders.
Reports from poison control centers and emergency rooms, along with graphic coverage of drug overdose incidents on social and other media, likely helped shift perception of the harms of these drugs, says Dr. Johnston.
MTF asked students about more than 50 classes and subclasses of drugs in 2013, “and the list of drugs keeps growing,” says Dr. Johnston. Several drugs, such as bath salts, are often chemically altered to evade bans by the Food and Drug Administration, he explains, and many are manufactured outside the United States, without regulation of their quality or content. “Nobody knows what the consequences of taking these new drugs are,” says Dr. Johnston, “not even the people who are making them.”
In response to the challenge posed by the growing influx, the Chemistry and Drug Metabolism Section of NIDA’s Intramural Research Program has implemented a designer drug initiative. Researchers are using state-of-the-art technology to identify the drugs’ metabolism and pharmacological activity in key body tissues. These investigations will provide clinicians, policy makers, and the public with useful guidance on these drugs’ effects and dangers.
Read further details on the MTF survey.
