Why Are Our Brains So Big and Powerful?

This is Archived content. This content is available for historical purposes only. It may not reflect the current state of science or language from the National Institute on Drug Abuse (NIDA). For current information, please visit nida.nih.gov.

Why Are Our Brains So Big and Powerful?


Research suggests that unique patterns of gene regulation have contributed to the differences in brain size and capacity that distinguish humans from other animals.

The figure shows graphic representations of the brains of a mouse, monkey, and human, drawn to scale. The mouse brain is the smallest, with a length of about 1.5 cm; the monkey brain has an approximate length of 10 cm; and the human brain is the largest with an approximate length of 16 cm. In addition, the mouse brain shows very little folding of its outer surface, and the human brain shows a greater extent of folding than the monkey brain.


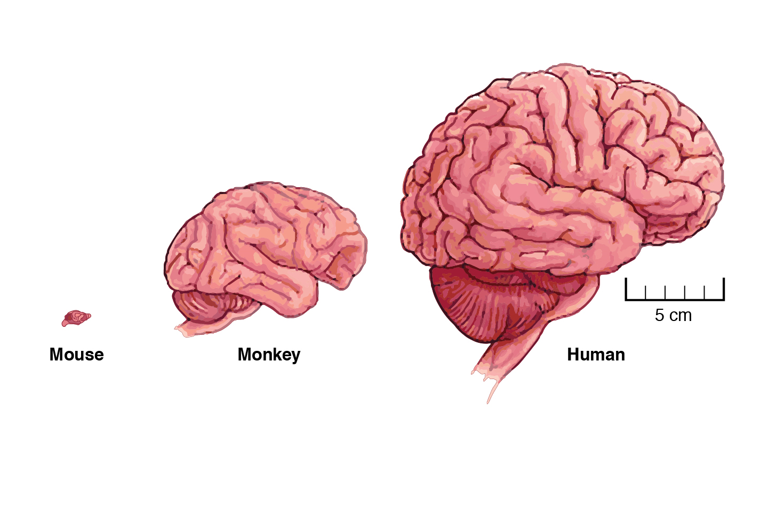
Differences in cortical size and organization underlie many of the unique capabilities that distinguish humans from other species, such as higher cognition and language. The human brain also has distinctive vulnerabilities, such as susceptibility to addiction.

How did these differences come about, when we share almost all of the genes that contribute to cortical development with other animals?


The figure shows a graphical representation of 10 stages of human brain development—at 25 days, 35 days, 40 days, 50 days, 100 days, 5 months, 6 months, 7 months, 8 months, and 9 months of fetal development. The images are not drawn to scale. At 25 days, the developing brain resembles a simple tube. At 35 days, the tube has expanded and is beginning to fold up. At 40 days, more folds appear in the tube-like brain structure. At 50 days, the front end of the tube enlarges and begins to form a “clump”. This process continues at 100 days. At 5 months, the fetal brain has grown and assumed the overall shape seen after birth, with different brain regions distinguishable, but a smooth outer surface. At 6 months, the first folds in the brain’s outer surface appear. At 7 and 8 months, the brain grows and the extent of folding of the brain surface increases. At 9 month, the characteristic folds of the human brain have appeared.
 

Drs. Pasko Rakic and James P. Noonan, with colleagues at Yale University, investigated an idea that evolutionary geneticists have often proposed.

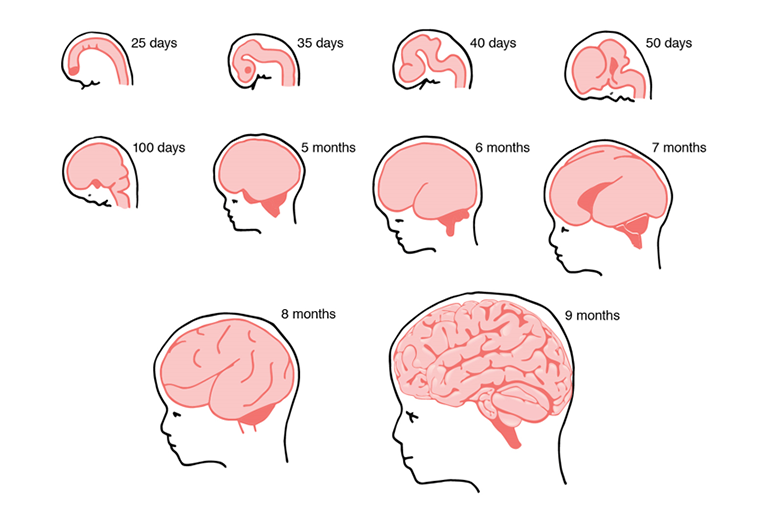
Dr. Noonan explains, “It’s a long-standing hypothesis that changes in how genes are controlled, in addition to actual changes in the genes themselves, might govern evolutionary innovations such as the human cortex. The idea is that because the genes that control early brain development are very similar across species, differences in how and when these genes are expressed may distinguish the species from one another.”

Image adapted from http://image.slidesharecdn.com/031609-phitchcock-cerebralcortexlecture-110718230733-phpapp01/95/031609b-cerebral-cortex-39-728.jpg?cb=1311031041

The figure shows a graphic representation of a gene and the regulatory elements in the DNA that control the gene’s expression. A green box represents a regulatory element called a promoter. It is located directly adjacent to the left of a blue box representing a gene. A black arrow above the “gene” box represents the start and direction of the first step of gene expression, called transcription. To the right of the “gene” box is a blue line representing other, unrelated DNA sequences. At the far right is a yellow box representing another regulatory element called an enhancer. An arrow points back from the enhancer to the promoter.
 

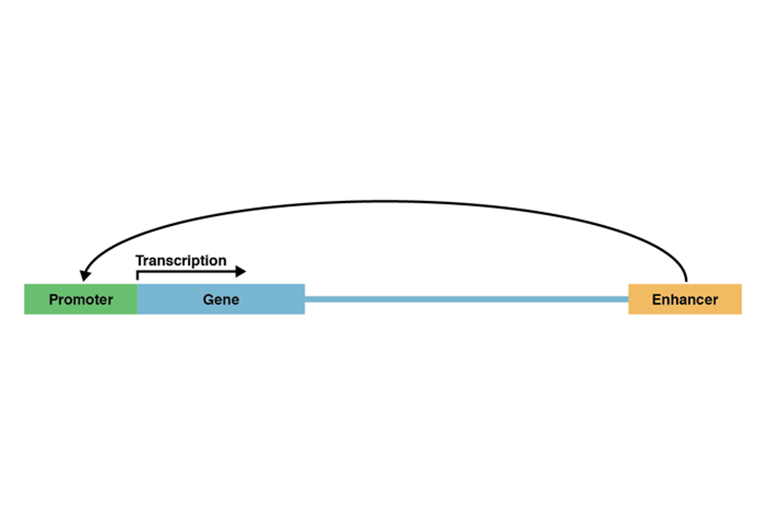
To test the hypothesis, the Yale team compared the activity levels of two regulators of gene expression in human, rhesus macaque, and mouse embryonic brain tissue. One of the regulators, called the gene promoter, is a DNA sequence located in front of a gene. When activated by the cell’s transcription machinery, it initiates the process of protein building. The other sequence, the gene enhancer, is a DNA sequence situated relatively far from a gene, in front or behind. Enhancers, too, promote gene expression when activated.

The figure shows two graphic representations of DNA and associated histone proteins. The panel on the left illustrates the configuration of DNA and histone proteins when no gene transcription occurs, and the panel on the right illustrates the configuration during active gene transcription. The DNA is represented by a dark blue line that is wrapped twice around brown cylindrical shapes representing the histone proteins. Short stretches of red in the DNA represent promoters and enhancers that control gene transcription. At the top of these DNA-histone complexes, light blue and dark blue ovals represent two forms of a specific histone protein, H3K27. In the left panel, light blue ovals represent normal H3K27. In this panel, the DNA-histone complexes are located close to each other, with the red promoter/enhancer sequences close to the histone cylinders and therefore inaccessible to other proteins required for transcription. This indicates that unmodified H3K27 keeps the DNA tightly wound around the histones, precluding gene transcription. In the right panel, dark blue ovals represent modified H3K27ac. In this panel the DNA-histone complexes are spaced further apart, with a free stretch of the blue DNA line and the red promoter/enhancer sections between the histone cylinders. This indicates, that a chemical modification—namely the addition of an acetyl group—to H3K27, which yields H3K27ac, opens up the DNA-histone complex and enables active gene transcription.
 

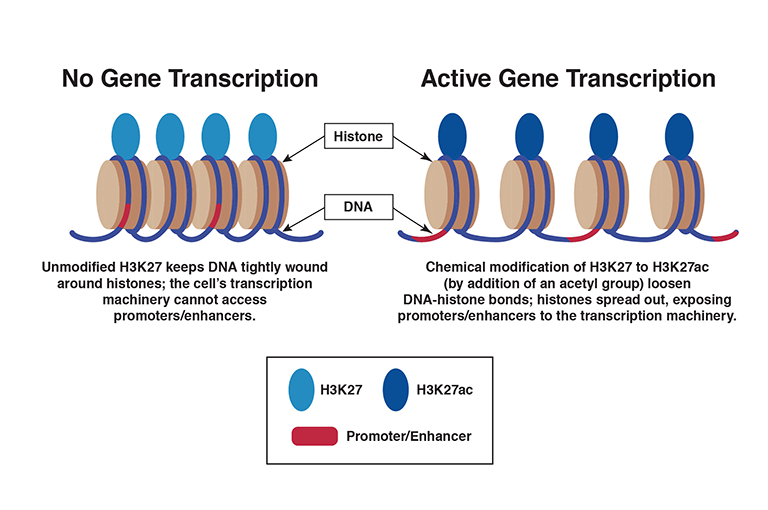
To determine the activity levels of gene promoters and enhancers, the researchers measured the levels of two proteins. The proteins, H3K27ac and H3K4me2, are modified forms of proteins (H3K27 and H3K4) that attach to histones, spool-like structures that bind with DNA.

When H3K27 and H3K4 are unmodified, DNA forms tight bonds with histones and holds them close together. Modification to H3K27ac and H3K4me2 loosens the bonds and the histones spread out, exposing DNA, including promoters and enhancers, to the transcription machinery.

Dr. Noonan says, “Simply put, the amount of [H3K27ac and H3Kme2] correlates with the activity of a promoter or enhancer.”

The top part of the figure shows three graphic representations of three stages of human development, namely at 7 weeks, 8.5 weeks, and 12 weeks. The developing brain is represented as a light-brown roundish or oval shape located on top of gray areas representing other fetal structures. Beneath each drawing is a bar to illustrate the scale of the drawing. The length of the bar represents 2 mm in the left panel, 4 mm in the middle panel, and 1 cm in the right panel. The brain at 7 weeks is about 1.5 mm in length; at 8.5 weeks, about 10 mm; and at 12 weeks, about 3 cm in length. The bottom part of the figure shows a circle illustrating the proportion of promoters and enhancers containing chemically modified histone proteins that indicate active gene transcription, measured in human brain at 7.5 weeks of development. The left half of the circle represents the findings for 19,921 promoters, and the right half represents the findings for 31,766 enhancers. Different color blocks in the circle represent the presence of specific chemical histone modifications. Light purple sections represent promoters and enhancers containing only H3K27ac, light green sections represent promoters and enhancer containing both H3K27ac and H3K4me2, and light teal sections represent promoters and enhancers containing only H3K4me2. A cut-out section at the top represents 1,555 promoters and 5,187 enhancers that contain higher levels of modified H3K27 and H3K4 in humans than in other species. Dark purple sections represent promoters and enhancers with higher levels of H3K27ac, dark green sections represent promoters and enhancers with higher levels of both H3K27ac and H3K4me2, and dark teal sections represent promoters and enhancer with higher levels of H3K4me2.
 

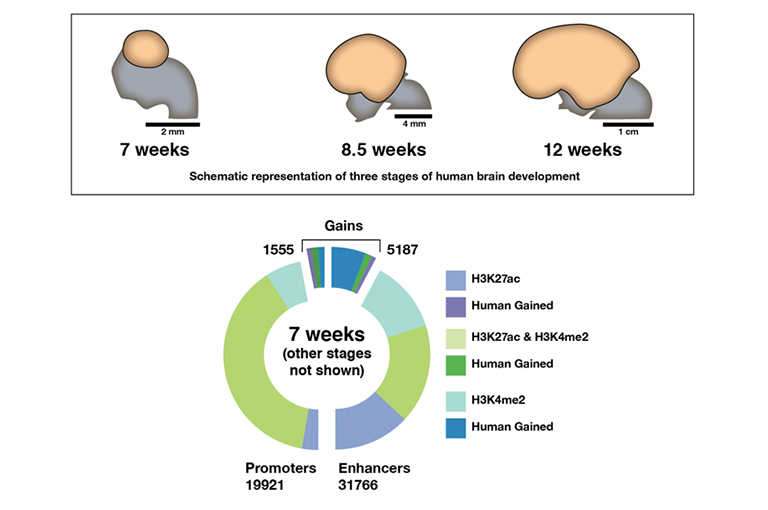
The Yale team measured H3K27a and H3Kme2 levels associated with 22,139 gene promoters and 52,317 gene enhancers in human brain tissue at 7, 8.5, and 12 weeks of embryonic development. They measured the modified proteins at the same sites in rhesus macaque monkey and mouse tissue at the analogous stages of development.

They found higher levels of one or both modified proteins adjacent to 2,885 promoters and 8,996 enhancers in humans, compared to the other species, at one or more of the three stages of development. The genes influenced by these promoters and enhancers are likely transcribed at higher rates in humans than in the other species during those developmental stages.

The figure shows a graphic representation of gene networks that in humans have higher levels of modified histones than in other species. Different-colored hexagons represent individual gene networks, or modules, that are connected with each other, as indicated by gray lines. Hexagons of the same color represent modules involved in similar functions. Orange hexagons represent modules involved in cell proliferation, red hexagons represent modules involved in extracellular matrix building, and blue hexagons represent modules involved in patterning. Light and dark gray hexagons have no assigned functions. Black arrows connect some of the modules with specific other modules. Text boxes list the names of transcription factors—SMAD, KLF4, ETS1, PLAG1, and TFAP2C—that mediate the interactions indicated by the black arrows.
 

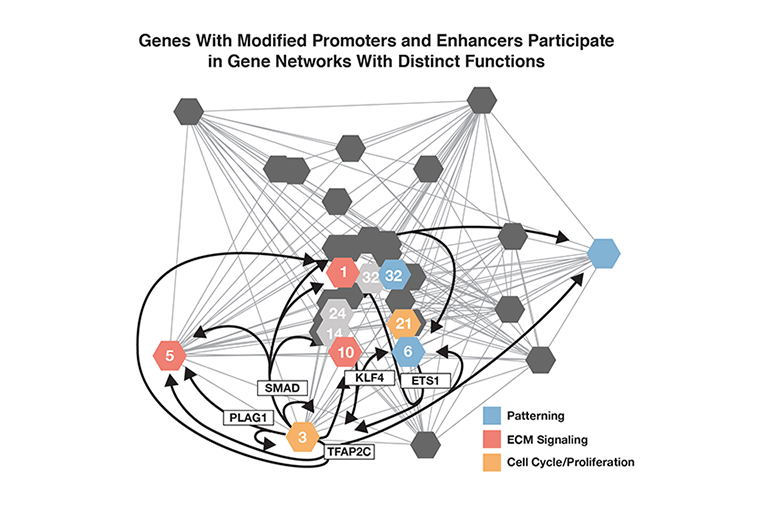
The Yale researchers identified many of the genes whose promoters and/or enhancers were associated with higher levels of H3K27ac or H3K4me2, and therefore are likely more active in humans relative to the other species. Many belong to networks with known roles in early brain development, for example:

  • Cell proliferation—the birth of neurons from stem cell precursors
  • Extracellular matrix building—laying in the structure that guides individual neurons to their final positions in the brain
  • Patterning—the development of distinct functional brain areas

The researchers propose that these and other differences in gene regulation have helped the human brain evolve its unique size, structure, and power.

The figure illustrates genetic differences between human and monkey or mouse, respectively. The figure shows three copies of a gene structure with, from left to right, promoter (indicated as a green box), gene (indicated as a blue box), unrelated DNA (indicated as a blue line), and enhancer (indicated as a yellow box) also seen in slide 3. Silhouettes indicate the source of the DNA, with a monkey for the top line, a human for the middle line, and a mouse for the bottom line. Red double-headed vertical arrows indicate genetic differences between two neighboring organisms. More red arrows, indicating more genetic differences, are found in the regulatory regions—that is, promoter and enhancer regions—than in the gene regions. Moreover, there are more red arrows, indicating more genetic differences, between human and mouse than between human and monkey.
 

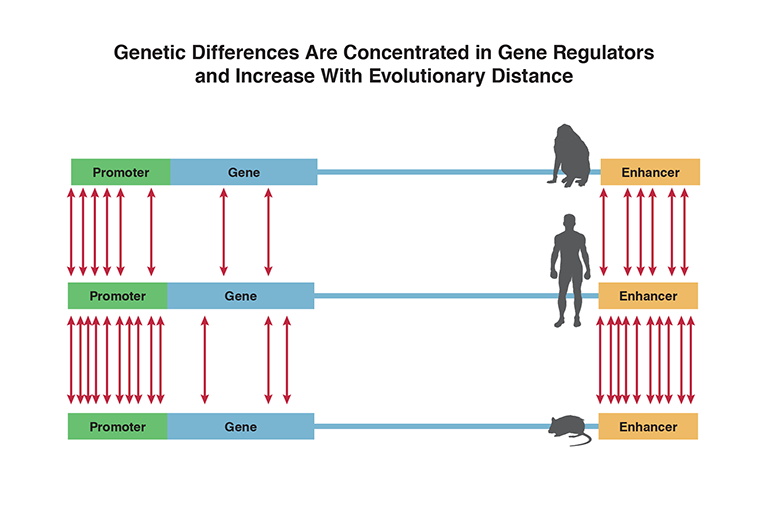
Most genetic differences between species are in gene regulators, such as promoters and enhancers, rather than in genes themselves. Differences are more numerous between species of greater evolutionary distance from each other. Dr. Rakic summarizes, “Most of the genome is conserved across species. Less than 0.5 percent of our genes are unique to humans. Most of the differences we see between species are in the regulatory DNA, including promoters and enhancers. These elements are more numerous than the genes themselves and determine the course of an organism’s development.”

Along with the increased size and capacities of our brain, our unique human patterns of gene regulation and expression may contribute to some of our weaknesses. Dr. Rakic says that our vulnerability to addiction is an example. He explains, “Something in the human brain makes us prone to addiction. This vulnerability isn’t present in other species to the same extent. Identifying genetic differences between species, including differences in regulatory DNA sequences, can inform our understanding of why we’re prone to addiction.”

The figure shows the graphic representation of a gene and its regulatory sequences as described before, with, from left to right, a promoter (green box), the gene itself (blue box), unrelated DNA sequences (blue line), and enhancer (yellow box). Red vertical arrows above the gene represent genetic variants between individuals that may be associated with increased risk of compulsive behaviors. The arrows are clustered above the promoter and enhancer regions, and only a few are found over the gene region. A large blue downward arrow indicates that these findings may lead to the development of behavioral therapies or pharmacotherapy that is tailored to the genetic makeup of the patient.
 

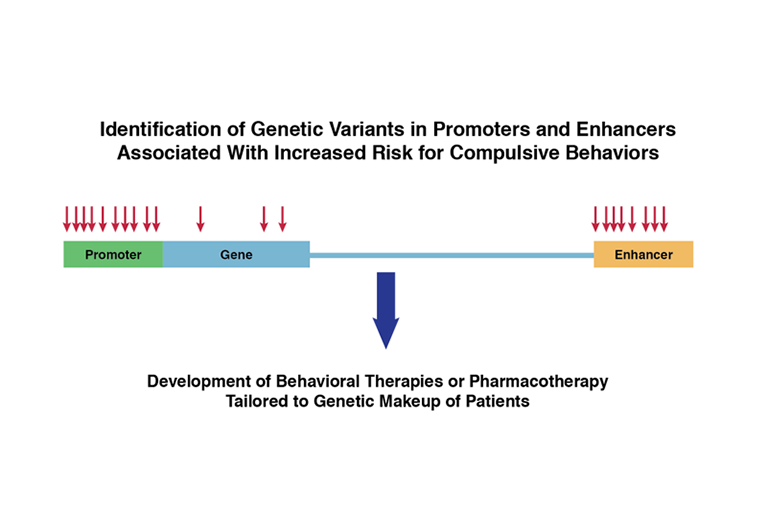
Dr. Da-Yu Wu of NIDA’s Genetics Workgroup speculates that the Yale team’s findings may, in time, have a significant impact on addiction research and treatment. He notes that substances of abuse may affect the genes driven by the human-specific promoters and enhancers associated with brain development. Therefore, these genes and their regulators could represent new therapeutic targets. Dr. Noonan finds this idea intriguing, “It’s possible, because pharmacologic agents can alter gene expression and epigenetic states in living cells.”

Dr. Wu also speculates that the researchers’ insights could guide the development of precision—or even personalized—medications for addiction treatment. Dr. Noonan elaborates, “Regulatory maps of brain development could help us interpret variations in promoters and enhancers, and perhaps other noncoding DNA regions, that are associated with addiction risk. Genetic risk factors may converge in particular regulatory pathways. If we could determine this, we might be able to identify the biological processes that are affected.”

This study was supported by NIH grants DA023999, NS014841, GM094780, and GM106628.

Source: Reilly, S.K.; Yin, J.; Ayoub, A.E.; Emera, D.; Leng, J.; Cotney, J.; Sarro, R.; Rakic, P.; Noonan, J.P. Evolutionary changes in promoter and enhancer activity during human corticogenesis. Science. 2015 Mar 6;347(6226):1155-9. Article