Nonmedical Opioid and Heroin Use Among High School Seniors

This is Archived content. This content is available for historical purposes only. It may not reflect the current state of science or language from the National Institute on Drug Abuse (NIDA). For current information, please visit nida.nih.gov.

The slide shows the silhouettes of male and female high school students above the title of the presentation, 'Nonmedical Opioid and Heroin Use Among High School Seniors.'

Dr. Joseph Palamar and a team of researchers at New York University studied nonmedical use of prescription opioids (NMO) and use of heroin among 68,000 high-school seniors who participated in the NIDA-funded Monitoring the Future Study (MTF) between 2009 and 2013.

This research showed that:

  1. NMO use was 10 times more common than heroin use.
  2. Strong correlations existed between NMO and heroin use.
  3. Associations existed between NMO/heroin use and gender, race, and student income.
The figure shows a horizontal bar graph illustrating the use of heroin and nonmedical opioids (NMOs) among 68,000 high school seniors surveyed. The horizontal (x)-axis shows the proportion of students using the respective drugs. The vertical (y)-axis shows the type of drug used. The dark blue bar indicates that of the 68,000 students surveyed, 1.2 percent, or 819 students, had used heroin, indicated by a syringe symbol. The light blue bar shows that of the 68,000 students surveyed, 10.9 percent, or 7,412 students, had used NMO 1 to 39 times in their lives, represented by a pill symbol. The gray bar indicates that of the 68,000 students surveyed, 1.5 percent, or 993 students, had used NMO frequently, defined as 40 or more times, represented by a two-pill symbol.

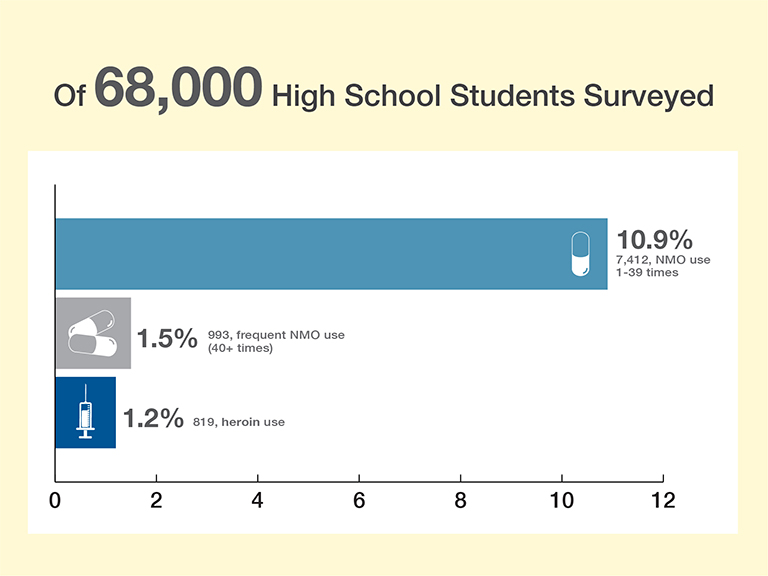
Of 68,000 high school students surveyed, 10.9 percent reported NMO use 1-39 times, 1.5 percent reported frequent NMO use (40+ times), and 1.2 percent reported having used heroin.

This figure shows a bar graph illustrating that strong correlations exist between nonmedical opioid (NMO) and heroin use. The horizontal (x)-axis shows the type of correlation. The vertical (y)-axis shows the proportion of students using one type of drug who also use a second type of drug. The dark blue bar on the left shows that heroin use is associated with NMO use. It indicates that of all the high school seniors reporting any heroin use (indicated by the syringe symbol), 77.3 percent also reported having used NMO at least once (indicated by the pill symbol). The light blue bar on the right illustrates that frequent NMO use is associated with heroin use, because of all the students who reported frequent NMO use (indicated by the two-pill symbol), almost one-quarter, or 23.3 percent, also had used heroin (indicated by the syringe symbol).

NMO use was much more prevalent among the 819 students who had used heroin than among the total population of students (77.3 percent vs. 12.4 percent). Heroin use was much more prevalent among the 993 students who reported frequent NMO use than among the total population of students (23.2 percent vs. 1.2 percent).

The figure is a bar graph illustrating the use of nonmedical opioids (NMOs) and heroin among 68,000 students based on gender. The horizontal (x)-axis shows the type of drug used. The vertical (y)-axis shows the risk of drug use, expressed as the adjusted odds ratio. Drug users are divided into three groups: those who have used NMOs at least once are represented by a one-pill symbol; those who have used NMOs at least 40 times are represented by a two-pill symbol, and those who have used heroin at least once are represented by a syringe symbol. In the figure, male students are represented by blue bars and female students by red bars. The left pair of bars shows the adjusted odds ratio for male and female students having used NMO at least once. The adjusted odds ratio for male students has been set to 1.0; the adjusted odds ratio for female students is 0.79. The middle pair of bars shows the adjusted odds ratios for having used NMO frequently. The adjusted odds ratio for male students is set at 1.0, and the adjusted odds ratio for female students is 0.59. The right pair of bars shows the adjusted odds ratios for having used heroin at least once. Again, the adjusted odds ratio for male students has been set to 1.0 and the adjusted odds ratio for female students is 0.57. Thus, male students were more likely than female students to report NMO and heroin use, with greater differences reported for frequent NMO use and heroin use than for lifetime NMO use.

The researchers compared the likelihood of opioid use by female and male students. They estimated that, adjusting for other factors that can influence drug use, females were 79 percent as likely as males to report NMO use, 59 percent as likely to report frequent NMO use, and 57 percent as likely to report heroin use.

The figure is a horizontal bar graph illustrating the use of nonmedical opioids (NMOs) and heroin among 68,000 students based on race. It is divided into three panels to indicate three groups of drug users: those who have used NMOs at least once are represented by a one-pill symbol; those who have used NMOs at least 40 times are represented by a two-pill symbol; and those who have used heroin at least once are represented by a syringe symbol. The horizontal (x)-axis shows the risk of drug use, expressed as the adjusted odds ratio, which is represented by the length of the bars. The vertical (y)-axis of the graphs show the three races analyzed. White students are represented by blue bars, Hispanic students by green bars, and black students by yellow bars. 
The left part of the figure shows the adjusted odds ratios for reporting any NMO use. The odds ratio for white students has been set to 1.0. The adjusted odds ratio for Hispanic students is 0.54, and the adjusted odds ratio for black students is 0.36. The middle part of the figure shows the adjusted odds ratios for reporting frequent NMO use. The adjusted odds ratio for white students has again been set to 1.0. The adjusted odds ratio for Hispanic students is 0.38, and the adjusted odds ratio for black students is 0.26. The right part of the figure shows the adjusted odds ratios reporting any heroin use, with the adjusted odds ratio for white students again set as 1.0. The adjusted odds ratio for Hispanic students is 0.71, and the adjusted odds ratio for black students is 0.52. Thus, for all three drug-use categories, white students were more likely than Hispanic and black students to report use, and Hispanic students were more likely to report drug use than were black students.

Blacks and Hispanics were less likely than Whites to use opioids. The differences were greatest for frequent NMO use, intermediate for lifetime NMO use, and smallest for lifetime heroin use. Blacks were least likely to report any of the three types of drug use.

The figure is a bar graph illustrating the use of nonmedical opioids (NMOs) and heroin among 68,000 students based on income from sources other than part-time employment. The horizontal (x)-axis shows the type of drug used. The vertical (y)-axis shows the risk of drug use, expressed as the adjusted odds ratio. Drug users are divided into three groups: those who have used NMOs at least once are represented by a one-pill symbol; those who have used NMOs frequently are represented by a two-pill symbol, and those who have used heroin at least once are represented by a syringe symbol. Light blue bars indicate a weekly income from sources other than part-time employment of $0–10, brown bars indicate an income of $11–50, and dark blue bars indicate an income of more than $50. The left part of the figure shows the likelihood of having used NMOs at least once for the three income categories. The adjusted odds ratio for an income of $0-10 has been set to 1.0. The adjusted odds ratio for an income of $11-50 is 1.48, and the adjusted odds ratio for an income of more than $50 is 1.85. The middle part of the figure shows the likelihood of having used NMOs at least 40 for the three income categories. The adjusted odds ratio for an income of $0-10 has again been set to 1.0. The adjusted odds ratio for an income of $11-50 is 1.8, and the adjusted odds ratio for an income of more than $50 is 3.27, The right part of the figure shows the likelihood of having used heroin at least once for the three income categories. The adjusted odds ratio for an income of $0-10 has again been set to 1.0. The adjusted odds ratio for an income of $11-50 is 1.27, and the adjusted odds ratio for an income of more than $50 is 2.66. Thus, for all three categories of drug use, the likelihood increased with weekly income, with the greatest difference reported for frequent NMO use.

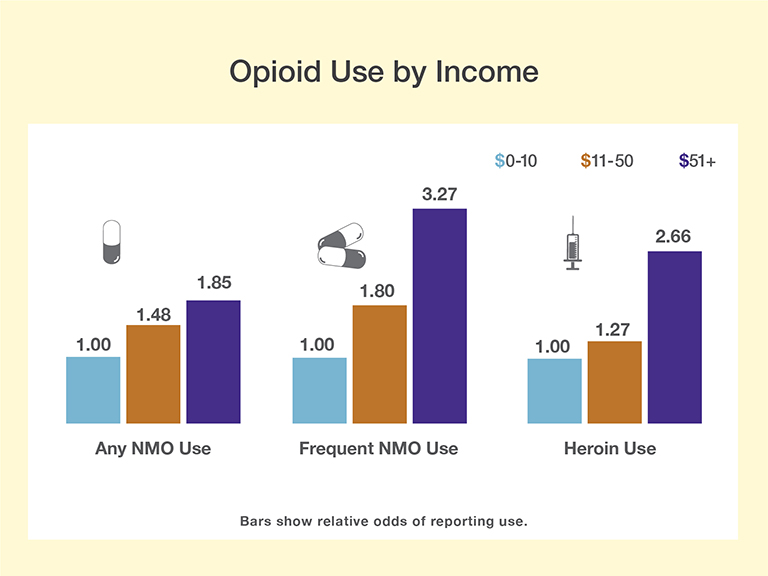
Students with higher income from part-time employment were more likely than those with lower income to report NMO or heroin use. The association with income was strongest for frequent NMO use and stronger for heroin use than for lifetime NMO use. Income had the smallest effect on lifetime NMO use.

The researchers note that their analysis did not include data for similarly aged adolescents not enrolled in school. Some experts predict that NMO and heroin use may be higher among those young people.

This study was supported by NIH grant DA-038800.

Source
Palamar, J.J., Shearston, J.A., Dawson, E.W., et al. Nonmedical opioid use and heroin use in a nationally representative sample of U.S. high school seniors. Drug and Alcohol Dependence 158:132-138, 2016. Full text