This clinical trial:
- Found that patients who self-administered cognitive behavioral therapy (CBT) using computerized training modules reduced their drug use as much as patients who received clinician-delivered CBT, and they maintained this advantage through a 6-month follow-up.
- Suggests that by reducing the time that clinicians need to spend with individual patients, computer-based CBT training may enable treatment programs to accommodate larger caseloads and increase access to treatment.
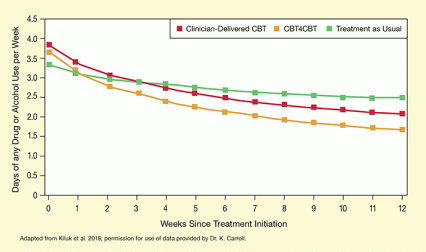
In this NIDA-sponsored trial, patients who were assigned to complete one module of Computer-Based Training for Cognitive Behavioral Therapy (CBT4CBT) each week for 12 weeks reduced their drug use by about half over 12 weeks (Figure 1). A comparison group assigned to attend 12 weekly 1-hour CBT sessions with a clinician reduced their drug use by roughly the same amount, while a group assigned to treatment as usual (TAU) (i.e., weekly group therapy) was significantly less successful in reducing use.
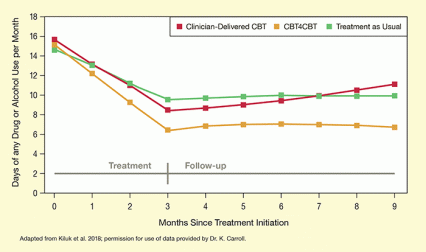
The 137 study participants were recruited for the trial when seeking treatment for cocaine, marijuana, opioid, or alcohol uncontrolled use or dependence. Those assigned to CBT4CBT visited the clinic once a week to have their progress monitored, which required about 10 minutes of clinician time. With this minimal clinician input, they provided the most drug-free urine samples (37 percent) of any of the groups during the 12-week trial and maintained their reduced rate of drug use throughout a 6-month post-trial follow-up (see Figure 2).
“CBT4CBT is web-based, so patients can access it whenever and wherever they want,” says Dr. Kathleen Carroll, who developed the program with colleagues at Yale University School of Medicine and led the study. The program’s interactive modules feature graphics, quizzes, and printable practice exercises to teach and model CBT skills, such as coping with drug triggers and managing cravings. “We strove to make the modules engaging and fun,” says Dr. Carroll.
The CBT4CBT group stayed in treatment longer (64 days) than the clinician-delivered CBT and TAU groups in the clinical trial (55 and 43 days, respectively). On before-and-after tests of CBT knowledge that were administered to 50 patients, those in the CBT4CBT group scored greater gains than the other groups.
This study is the first to indicate that CBT4CBT is effective as a standalone treatment for substance use. Several previous studies established the program’s efficacy as an adjunctive treatment to clinician-delivered CBT. In one, Dr. Elise DeVito and colleagues tested CBT4CBT’s effect on how methadone-maintained patients with co-occurring opioid and cocaine use disorders responded to cocaine-associated cues. On a test called a “Drug Stroop Task,” CBT4CBT participants demonstrated greater cognitive control, less attentional bias toward the drug cues, and more engagement in the treatment program than TAU participants.
Dr. Carroll concludes, “CBT4CBT is at least as good as standard outpatient approaches and may be better than some, provided there is adequate clinical monitoring.”
This study was supported by NIH grants DA015969 and DA09241.
- Text Description of Figure 1
-
The graph shows the reduction in drug use during 12 weeks of treatment with CBT4CBT, clinician-delivered CBT, or treatment as usual. The horizontal x-axis shows the time since treatment initiation in weeks from 0 to 12. The vertical y-axis shows the days of any drug or alcohol use per week from 0 to 4.5. The green curve represents the patients receiving treatment as usual. Their drug or alcohol use declined steadily from about 3.4 days per week at the beginning of treatment to about 2.7 days per week after 12 weeks of treatment. The red curve represents the patients receiving clinician-delivered CBT. Their drug or alcohol use declined steadily from about 3.9 days per week at the beginning of treatment to about 2.3 days per week after 12 weeks of treatment. The yellow curve represents the patients receiving CBT4CBT. Their drug or alcohol use declined steadily from about 3.7 days per week at the beginning of treatment to about 1.9 days per week after 12 weeks of treatment.
- Text Description of Figure 2
-
The chart shows the reduction in drug use during 3 months of treatment and 6 months of follow-up with CBT4CBT, clinician-delivered CBT, or treatment as usual. The horizontal x-axis shows the time since treatment initiation in months from 0 to 9. A gray horizontal line with a tick mark at 3 months indicates that treatment lasted 3 months and was followed by 6 months of follow-up. The vertical y-axis shows the days of any drug or alcohol use per month from 0 to 18. The green curve represents the patients receiving treatment as usual. Their drug or alcohol use declined steadily from about 14.5 days per month at the beginning of treatment to about 9.5 days per month after 3 months of treatment. It remained at that level throughout the 6-month follow-up period. The red curve represents the patients receiving clinician-delivered CBT. Their drug or alcohol use declined steadily from about 15.5 days per month at the beginning of treatment to about 8.5 days per months after 3 months of treatment. However, drug or alcohol use increased again during the follow-up period, reaching about 11 days per month at 9 months after treatment initiation (i.e., 6 months of follow-up). The yellow curve represents the patients receiving CBT4CBT. Their drug or alcohol use declined steadily from about 15 days per month at the beginning of treatment to about 7 days per month after 3 months of treatment, and it remained at that level over the 6-month follow-up period.
Source:
- Kiluk, B.D., Nich, C., Buck, M.B., et al. Randomized clinical trial of computerized and clinician-delivered CBT in comparison with standard outpatient treatment for substance use disorders: Primary within-treatment and follow-up outcomes. Am J Psychiatry, 2018 May 24:appiajp201817090978. doi: 10.1176/appi.ajp.2018.17090978. [Epub ahead of print]


