This study:
- Demonstrated that cocaine increases expression of the protein E2F3a in the brain's reward system.
- Suggests that E2F3a elevation functions as a master switch for changes in gene expression that give rise to cocaine-related behaviors.
NIDA-supported researchers have shown that increased levels of a single protein in the brain's reward center are indispensable for producing some of cocaine's addiction-like effects in animals. Their findings highlight the involvement of a specific set of genes in the production of behavioral responses to cocaine and could point the way to medications to reduce the drug's hold on people.
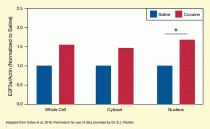
Dr. Hannah Cates, Dr. Eric Nestler, and colleagues from the Icahn School of Medicine at Mount Sinai in New York City demonstrated that cocaine increases expression of the gene (E2f3a) that produces the protein E2F3a in the mouse nucleus accumbens (NAc). The researchers repeatedly exposed mice to the drug, then used immunohistochemistry to compare NAc E2F3a levels in these animals and a control group of unexposed mice. The protein was markedly more abundant in the exposed animals (see Figure 1).
Dr. Cates and Dr. Nestler and colleagues next showed that increased E2F3a levels are a necessary and sufficient condition for two important addiction-like behavioral responses to cocaine. In these experiments, the researchers either enhanced or blocked expression of the E2f3a gene selectively in the NAc of mice and then assessed the animals' behavior after cocaine exposure. Mice with enhanced E2f3a expression—and thereby increased levels of the protein—exhibited locomotor stimulation and place preference responses after fewer repeated doses of cocaine compared with normal mice. Conversely, mice in which the E2f3a gene was suppressed required more repeated doses of the drug to develop the responses, compared with normal mice.
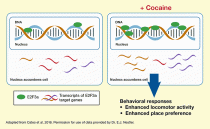
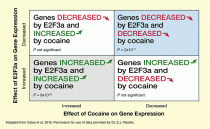
The E2F3a protein is a transcription factor; it attaches to the DNA of target genes and increases or decreases the genes' expression. The Mount Sinai researchers propose that when repeated cocaine exposure increases E2F3a, it disrupts the protein's regulation of its target genes, resulting in changes to cell structure and function that give rise to behavioral responses (see Figure 2). Consistent with this proposal, the researchers showed that increasing E2F3a in the absence of cocaine reproduced a large fraction of the same alterations in gene expression that repeated cocaine exposure produces, and which other research has associated with behavioral responses to the drug (see Figure 3).
Dr. Nestler concludes, "This study provided robust evidence that E2F3a is centrally involved in mediating the effects of repeated cocaine exposure on both behavior and gene expression in the brain's reward pathway." In follow-up research, he continues, "We are now defining the range of target genes through which E2F3a produces its behavioral and molecular actions. In the longer term, we hope to use this information to expand the range of targets against which novel therapeutics for cocaine addiction could be developed."
This study was supported by NIH grants DA007359 and DA008227.
- Caption and text description of Figure 1
-
Caption - To compensate for experimental variation in the isolation and measurement of E2F3a, the researchers also measured the levels of the protein actin, which is present in constant levels in all cells, and then determined the E2F3a/actin ratio. This ratio was arbitrarily set to 1.0 in saline-treated mice (blue bars). Compared with these animals, those administered cocaine (red bars) had higher levels of E2F3a. The increase in E2F3a was greater in the nucleus than in the surrounding cellular fluid (cytosol), consistent with E2F3a's known actions on DNA.
Text Description - The bar chart shows the levels of transcription factor E2F3a expression in the nucleus accumbens of mice treated with saline (represented by blue bars) or cocaine (represented by red bars). The horizontal x-axis shows the cell compartments in which E2F3a levels were measured. The vertical y-axis shows the level of E2F3a as determined by the E2F3a to actin ratio on a scale from 0 to 2.5. For saline-treated animals this ratio was arbitrarily set to 1.0 for all three cell compartments evaluated. The left pair of bars shows E2F3a levels in whole cells. The E2F3a/actin ratio in the saline treated animals was set at 1.0, and in the cocaine-treated animals it was about 1.5. The middle pair of bars shows E2F3a levels in the cytosol. In the saline treated animals, the E2F3a/actin ratio was again set to 1.0, and in the cocaine-treated animals it was about 1.4. The right pair of bars shows E2F3a levels in the nucleus. In the saline-treated animals the E2F3a/actin ratio was again set at 1.0, and in the cocaine-treated animals it was about 1.7. As indicated by the horizontal black bar and asterisk, this difference was statistically significant.
- Caption and text description of Figure 2
-
Caption - E2F3a enhances transcription of some of its target genes and inhibits transcription of others, and increased production of E2F3a amplifies these effects. Changes in cell structure and function may result that in turn give rise to behavioral responses such as enhanced locomotor activity or increased place preference.
Text Description - The figure illustrates the proposed effects of cocaine on E2F3a in the nucleus accumbens and the resulting consequences. The large teal rectangles represent nucleus accumbens cells, and the blue rectangles within them represent the cell’s nucleus. The light blue and brown double helix within the nucleus represents the cell's DNA and green ovals represent E2F3a molecules that bind to the DNA. Gold, red, and purple wavy lines represent transcripts of E2F3a target genes. The left panel shows the situation in the absence of cocaine. Normal E2F3a levels are represented by two green ovals binding to the DNA. At these E2F3a levels, the number of gold transcripts (one) is low, the number of red transcripts (three) is high, and the number of purple transcripts (two) is intermediate. The right panel shows the situation in the presence of cocaine. Cocaine induces increases in E2F3a levels as indicated by the increased number of green ovals. At these E2F3a levels, the number of gold transcripts is greatly increased (from one to four), the number of red transcripts is greatly reduced (from three to one), and the number of purple transcripts is lightly increased (from two to four). The blue arrow pointing down at the bottom right indicates that these changes may give rise to behavioral responses, such as enhanced locomotor activity and enhanced place preference.
- Caption and text description of Figure 3
-
Caption - The researchers compared the expression of all genes in the NAc of a) untreated animals, b) animals treated with cocaine, and c) animals treated to overproduce E2F3a. They identified genes whose expression was enhanced after both treatments (lower left quadrant), those whose expression was reduced after both treatments (upper right quadrant), and those whose expression was enhanced after one treatment but reduced after the other treatment (upper left and lower right quadrants). The odds were greatest that E2F3a overproduction increased expression of the same genes as did cocaine (gray quadrant) and, to a lesser extent, that E2F3a overproduction decreased expression of the same genes as did cocaine (blue quadrant).
Text Description - This figure shows that in the nucleus accumbens, E2F3a overexpression alters gene expression in a similar way to cocaine. The horizontal x-axis shows the effect of cocaine on gene expression, with increased gene expression indicated on the left side and decreased gene expression indicated on the right side. The vertical y-axis shows the effects of E2F3a overexpression on gene expression, with increased gene expression indicated at the bottom and decreased gene expression indicated at the top. The top left quadrant represents genes whose expression is decreased by E2F3a and increased by cocaine, the top right quadrant represents genes whose expression is decreased by both E2F3a and cocaine, the bottom left quadrant represents genes whose expression is increased by both E2F3a and cocaine, and the bottom right quadrant represents genes whose expression is increased by E2F3a and decreased by cocaine. The bottom left quadrant is shaded gray to indicate that the odds were greatest that E2F3a overexpression and cocaine both increased expression of the same genes. The top right quadrant is shaded blue to indicate intermediate odds that E2F3a overexpression and cocaine both decreased expression of the same genes. The white shading of the top left and bottom right quadrants indicates that odds were lowest that E2F3a overexpression and cocaine had opposite effects on gene expression.
Source:
- Cates, H.M., Heller, E.A., Lardner, C.K., et al. Transcription factor E2F3a in nucleus accumbens affects cocaine action via transcription and alternative splicing. Biol Psychiatry 84(3):167–179, 2018.


