

This study reported:
- The number of children (ages 3 to 11 years) in the United States who are exposed to tobacco smoke decreased steadily from 1999 to 2014.
- Childhood tobacco smoke exposure differs among sociodemographic groups.
Although childhood exposure to harmful tobacco smoke has decreased significantly in the past two decades, a new NIDA-sponsored study reports that significant disparities remain. Black children and those from low-income households are most likely to be exposed to tobacco smoke.
Dr. Ashley Merianos and colleagues from the University of Cincinnati, Cincinnati Children’s Hospital Medical Center, and the National Institute on Minority Health and Health Disparities examined the prevalence of tobacco smoke exposure (TSE) among 14,199 children ranging in age from 3 to 11 years who had participated in the 1999 to 2014 National Health and Nutrition Examination Survey (NHANES). The researchers measured blood serum levels of cotinine, a biomarker of TSE. Their analyses found that according to the most recent survey, an estimated 14 million children ages 3 to 11 still were exposed to tobacco smoke, but that the proportion of all children with TSE had dropped: from 64.5 percent in 1999 to 38.1 percent in 2014. This relative decline of 44.4 percent was slightly lower than the goal of 47 percent established by the Healthy People 2020 initiative—a national strategy launched by the federal government to identify diseases and disorders and to set measurable goals at the national, state, and local levels to improve public health.
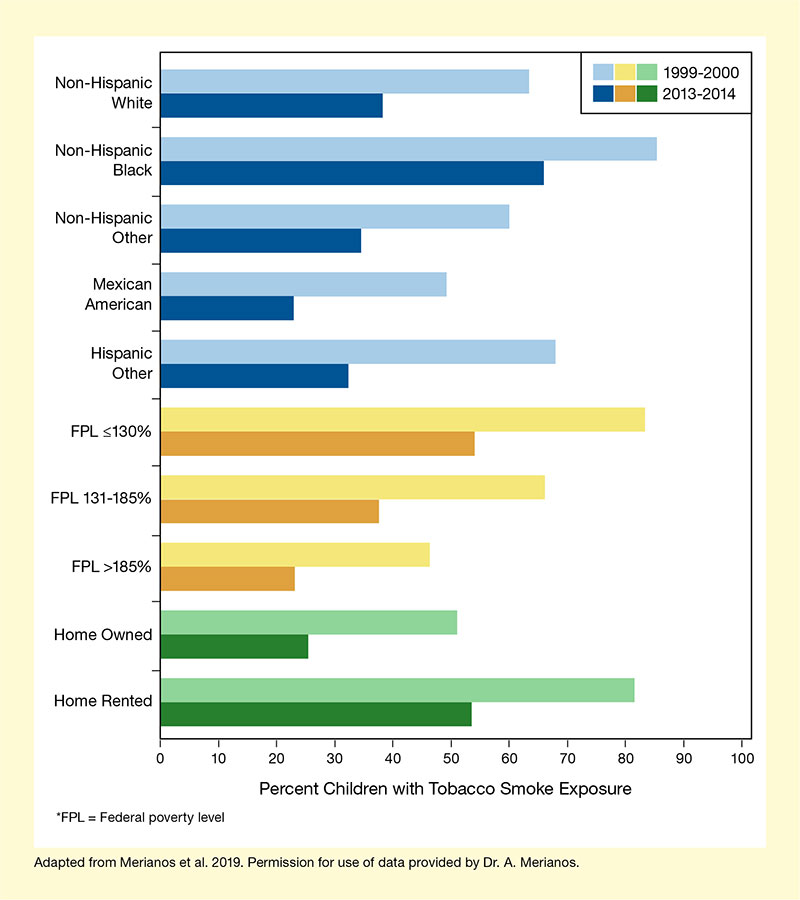
More in-depth analysis of data from the most recent survey (2013–2014) revealed persistent disparities in TSE among sociodemographic groups. For example, non-Hispanic black children were nearly two times more likely than non-Hispanic white children to be exposed to tobacco smoke, and children from low-income households (≤130 percent of the federal poverty level [FPL]) were 3.37 times more likely than those from the highest-income households (>185 percent of FPL) to be exposed. Children living in rented homes were 2.23 times more likely to be exposed to tobacco smoke than those living in family-owned homes (see Figure). These disparities were similar to those noted in the 1999–2000 survey.
"We found slower declines in exposure among certain groups, highlighting vulnerable child populations and the critical need for more work in this area to reduce their TSE," explains Dr. Merianos. TSE prevention and reduction efforts targeted to homes and schools in these communities may further reduce TSE prevalence and its associated health risks, including respiratory illnesses, infection, and premature death.
"Tobacco smoke exposure is a common and completely preventable hazard for children. Our study’s specific findings show a reduction in TSE over a 15-year period," says Dr. Merianos. However, she acknowledges that the study may have underestimated TSE in children who were infrequently exposed to tobacco smoke, because cotinine breaks down quickly, with a half-life of about 15 to 20 hours in children, and thus TSE may not have been captured accurately at the time of testing. Additionally, exposure of children older than age 11 years was not measured.
Dr. Merianos emphasizes the relevance of the findings. "These data are especially important for planning Healthy People 2030’s tobacco use objectives to continue implementing social and environmental changes and policies to eliminate child TSE," she says, adding, "It is important to continue setting these goals to increase the proportion of smoke-free homes, public places, and cars nationwide, and to establish the enforcement of supporting laws, such as banning smoking in private and public places."
This study was supported by NIDA grant DA044313.
- Text Description of Figure
-
The bar chart shows the proportion of children ages 3 to 11 years with tobacco smoke exposure in various sociodemographic groups. In each pair of bars, the light-colored bar indicates results from the 1999–2000 NHANES survey and the dark-colored bar indicates the results from the 2013–2014 survey. The five blue pairs of bars at the top represent subgroups based on race/ethnicity, the three yellow pairs of bars in the middle represent subgroups based on income, and the two green pairs of bars at the bottom represent subgroups based on housing situation. For all racial/ethnic groups, the percentage of children with TSE dropped from 1999–2000 to 2013–2014. In non-Hispanic white children (first pair of bars) it dropped from 63 percent to 38 percent; in non-Hispanic black children (second pair of bars) it dropped from 85 percent to 66 percent; in non-Hispanic other children (third pair of bars) it dropped from 60 percent to 35 percent; for Mexican-American children (fourth pair of bars) it dropped from 49 percent to 23 percent; and in other Hispanic children (fifth pair of bars) it dropped from 68 percent to 32 percent. Reductions in TSE also occurred for all three income-based groups from 1999–2000 to 2013–2014. For children with a family income less or equal to 130 percent of FPL (sixth pair of bars), TSE dropped from 83 percent to 54 percent; for children with a family income of 131 to 185 percent of FPL (seventh pair of bars), it dropped from 66 percent to 38 percent; and for children with a family income of greater than 185 percent of FPL (eighth pair of bars), it dropped from 46 percent to 23 percent. TSE also decreased in subgroups based on housing situation from 1999–2000 to 2013–2014. In children whose families owned the home where they lived (ninth pair of bars), TSE dropped from 51 percent to 25 percent, and in children whose families rented the home where they lived (tenth pair of bars), it dropped from 82 percent to 54 percent.
Source:
- Merianos, A.L., Jandarov, R.A., Choi, K., Mahabee-Gittens, E.M. Tobacco smoke exposure disparities persist in U.S. children: NHANES 1999-2014. Preventive Medicine. 123:138-142, 2019.