

This study found that:
- Using robotic technology, local levels of opioid metabolites can be measured in wastewater from individual manholes in a sewer system.
- Concentrations of nine illicit and prescription opioids, the opioid-agonist treatment drugs methadone and buprenorphine, and the opioid-antagonist overdose reversal drug naloxone in wastewater collected at 10 sites in a North Carolina municipality varied by site.
Wastewater-based epidemiology is a novel approach to study opioid exposure at the community level in order to help public health officials better understand and respond to the current opioid crisis in the United States. In a NIDA-sponsored study, Dr. Noriko Endo and colleagues at Biobot Analytics, Inc., in Somerville, Massachusetts, and from other institutions, used a robotic technology pioneered by one of the study's senior investigators, Dr. Mariana Matus, to sample wastewater from municipal sewers and measure the levels of various opioids. Dr. Peter R. Chai from Brigham and Women’s Hospital, another of the study’s senior investigators, explains that in the past, researchers seeking to directly measure opioid exposure were often limited by the fact that they only had access to people who had some sort of contact with the health care system (e.g., because they suffered an overdose or sought treatment). This made it difficult to obtain accurate data regarding overall opioid use because it excluded information from people who use these drugs and have no interaction with the health care system.
Evaluation of wastewater in municipal sewers to measure opioid use indirectly could overcome this limitation because it enables researchers to unobtrusively monitor the transit of pharmaceuticals consumed by humans. Previous wastewater analyses for opioids had been conducted in water treatment plants and therefore could measure opioid exposure only at the level of the entire community. In contrast, Dr. Endo and colleagues drew wastewater samples from individual manholes, thereby sampling in a much finer-grained way.
Wastewater Sampling Creates a Map of Opioid Exposure
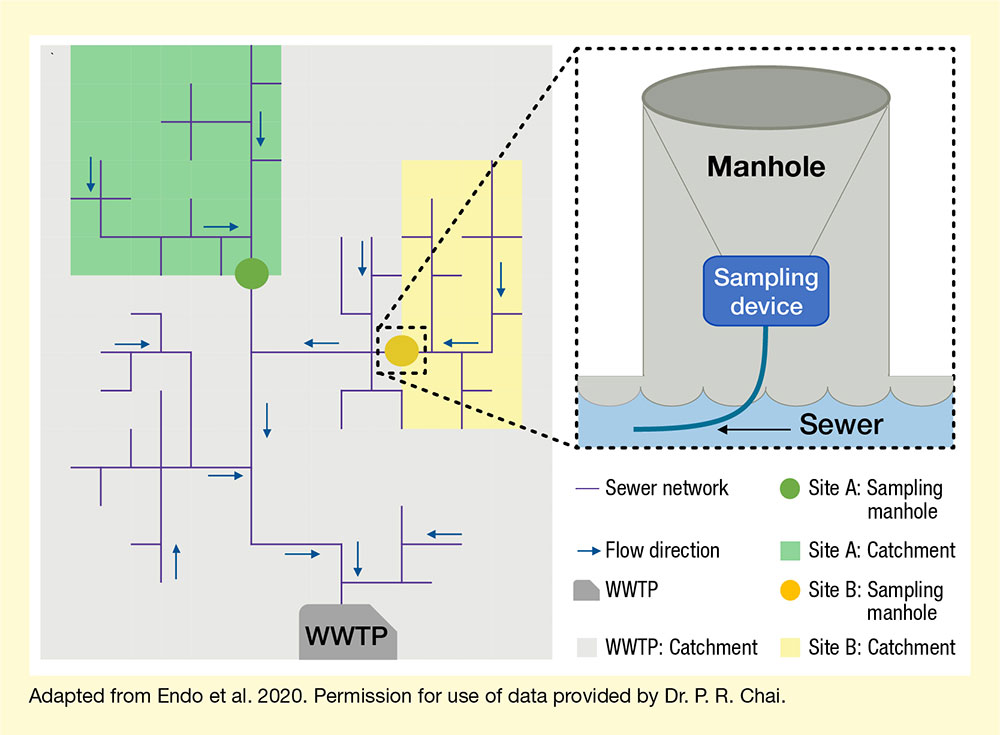
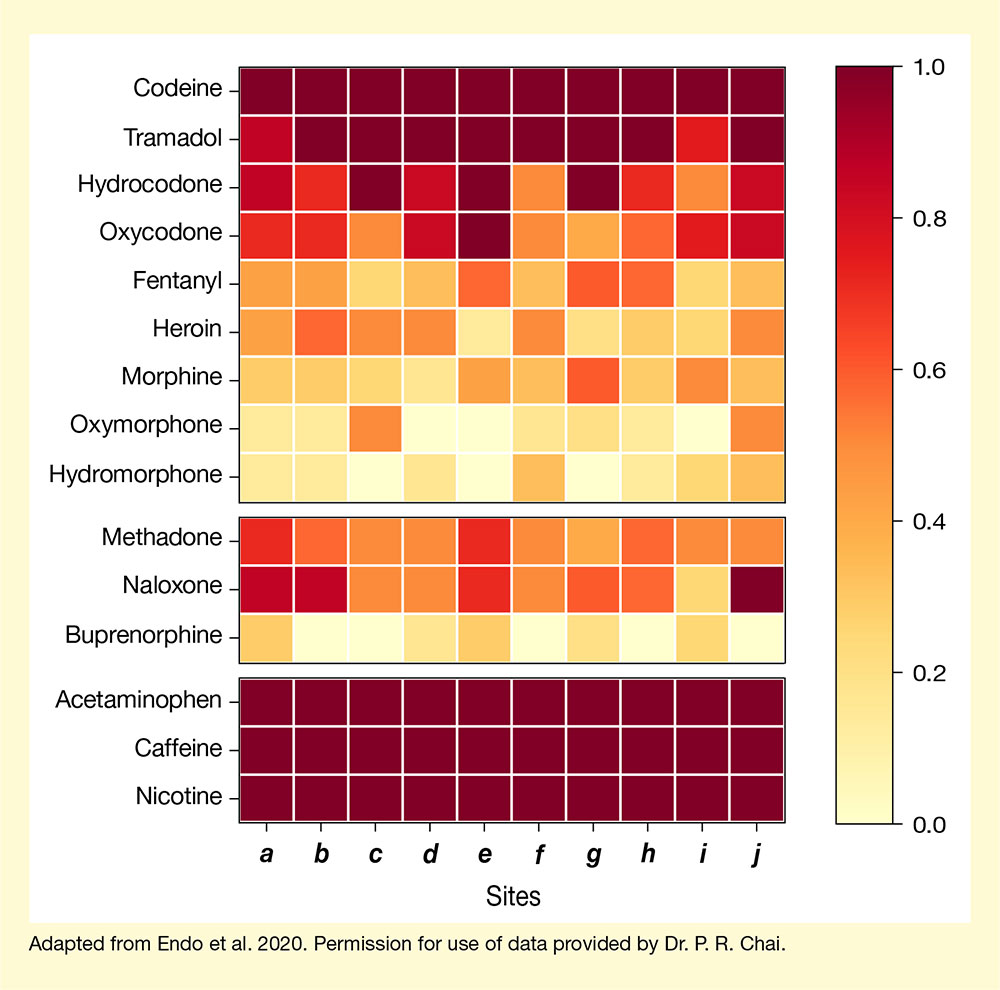
The researchers designed robotic sampling devices that can be placed in selected manholes and automatically sample wastewater at predetermined intervals. These devices were placed in 10 manholes in a North Carolina suburban area that had recently seen a spike in opioid misuse to create snapshots of the population’s drug consumption (see Figure 1). Information on the municipality’s wastewater network as well as land use and census-based demographic data were used to select manholes that were representative of the community’s demographic composition. Each manhole collected wastewater from at least 4,000 residents, and all 10 manholes together captured wastewater from about 72,000 residents, or about 44.5 percent of the community’s population. At each manhole, the investigators collected wastewater over 24 hours each on 7 days spread out over a 6-month period to account for individuals’ movements in and out of the area and fluctuations in substance use. They then analyzed the samples for the presence of nine illicit and prescription opioids; the opioid-agonist treatment drugs methadone and buprenorphine; the opioid-antagonist overdose reversal drug naloxone; and the commonly ingested substances caffeine, acetaminophen, and nicotine for control purposes (see Figure 2).
“Our data show that there are varying concentrations of opioids throughout the area we studied,” Dr. Chai says. The small sample size precluded detailed analyses of concentration fluctuations or correlations with neighborhood characteristics. However, the researchers were able to identify correlations between opioid overdose rates and the detection of treatment or overdose reversal drugs at the various sites. Dr. Chai further explains the benefits of this approach, “Instead of providing overall data for the suburban area, we were able to help public health officials think about where there are greater levels of opioid use in specific parts of the assessed region.” With such data, researchers could create maps based on the sewer system to better understand the local context of substance use.
Dr. Chai anticipates that availability of such objective opioid consumption data from different parts of a community could help public health officials more efficiently allocate resources such as community outreach, emergency medical services, or medication-assisted opioid use disorder treatment programs. Similarly, wastewater analysis data could allow key stakeholders to track the efficacy of prevention programs over time or to decide on necessary adjustments in intervention programs. He adds, “An interesting implication of this research is the use of this technology as a sentinel or ‘listening post’ system allowing us to continually sample wastewater in cities and look for new opioids or emerging trends of other drugs of abuse, such as methamphetamine.”
This work was supported by NIDA grants DA044874 and DA047236.
- Text Description of Figure 1
-
The figure shows a schematic of the experimental design for the wastewater analysis. A gray rectangle on the left side of the image represents the catchment area collecting the water for a specific wastewater treatment plant, indicated by a dark gray shape at the bottom of the gray rectangle. A network of purple lines leading to this shape indicate sewer lines, with small blue arrows next to them indicating the direction of flow. A green rectangle at the top left of the gray rectangle and a yellow rectangle towards the right side of the gray rectangle represent two wastewater catchment areas for two sampling manholes indicated by darker green and yellow circles.
Dotted lines emanate from the yellow circle to an inset on the right that shows a schematic of the sampling manhole. The manhole is represented by a gray cylinder, with a blue area at the bottom of the inset representing the sewer water, which flows from right to left as indicated by an arrow. In the middle of the manhole is a blue rectangle that represents the sampling device, from which a dark blue line extends that represents the sampling probe.
- Text Description of Figure 2
-
The figure summarizes the opioid and control substance profiles measured in the wastewater at each sampling manhole. A color bar on the right ranging from light yellow to dark red indicates the percentage of samples at each site that were positive for the given opioid or control substance on a scale from 0 to 1.0, with darker colors indicating a higher proportion of positive samples. The sampling profiles are shown in a grid 10 squares wide and 15 squares high. Each square along the horizontal axis represents one sampling site, labeled from a to j. Each square along the vertical axis represents the substance analyzed. The top nine rows are for different opioid drugs. The next three rows are for the opioid treatment drug methadone, the overdose reversal drug naloxone, and the opioid treatment drug buprenorphine. The bottom three rows are for the control substances acetaminophen, caffeine, and nicotine.
For codeine (row 1), all squares are dark red. For tramadol (row 2), there is a medium red square, seven dark red squares, a light red square, and a dark red square. For hydrocodone (row 3), there are a medium red square, a light red square, a dark red square, a medium red square, a dark red square, a medium orange square, a dark red square, a light red square, a light orange square, and a medium red square. For oxycodone (row 4), there are two light red squares, a medium orange square, a medium red square, a dark red square, a medium orange square, a light orange square, a dark orange square, and two medium red squares. For fentanyl (row 5), there are two light orange squares, a medium yellow square, a dark yellow square, a dark orange square, a dark yellow square, two dark orange squares, a medium yellow square, and a dark yellow square. For heroin (row 6), there are a light orange square, a dark orange square, two medium orange squares, a medium yellow square, a medium orange square, a medium yellow square, a dark yellow square, a medium yellow square, and a medium orange square. For morphine (row 7), there are two dark yellow squares, two medium yellow squares, a medium orange square, a dark yellow square, a dark orange square, a dark yellow square, a medium orange square, and a dark yellow square. For oxymorphone (row 8), there are two medium yellow squares, a medium orange square, two light yellow squares, three medium yellow squares, a light yellow square, and a medium orange square. For hydromorphone (row 9), there are two medium yellow squares, a light yellow square, a medium yellow square, a light yellow square, a dark yellow square, a light yellow square, a medium yellow square, and two dark yellow squares.
For methadone (row 10), there are a light red square, a dark orange square, two medium orange squares, a light red square, a medium orange square, a light orange square, a dark orange square, and two medium orange squares. For naloxone (row 11), there are two medium red squares, two medium orange squares, a light red square, a medium orange square, two dark orange squares, a medium orange square, and a dark red square. For buprenorphine (row 12), there are a dark yellow square, two light yellow squares, a medium yellow square, a dark yellow square, a light yellow square, a medium yellow square, a light yellow square, a medium yellow square, and a light yellow square.
For the control substances acetaminophen (row 13), caffeine (row 14), and nicotine (row 15), all squares are dark red.
Source:
- Endo, N., Ghaeli, N., Duvallet, C., et al. Rapid assessment of opioid exposure and treatment in cities through robotic collection and chemical analysis of wastewater. J Med Toxicol 16 (2):195-203, 2020.