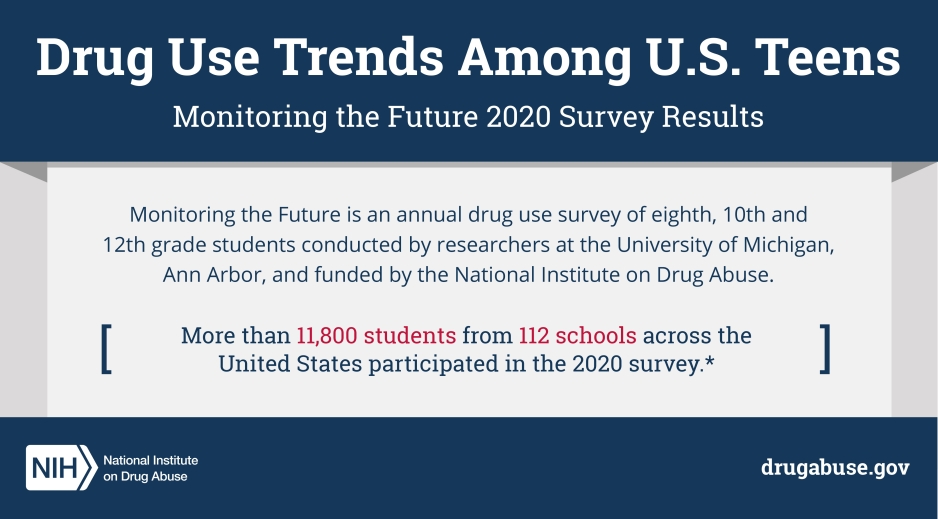
Monitoring the Future is an annual drug use survey of eighth, 10th and 12th grade students conducted by researchers at the University of Michigan, Ann Arbor, and funded by the National Institute on Drug Abuse.
More than 11,800 students from 112 schools across the United States participated in the 2020 survey.*
*Data collection stopped prematurely due to the COVID-19 pandemic. Completed surveys represent about 25% of the size of a typical year’s data collection. However, results were gathered from a broad geographic range and were statistically weighted to be nationally representative.
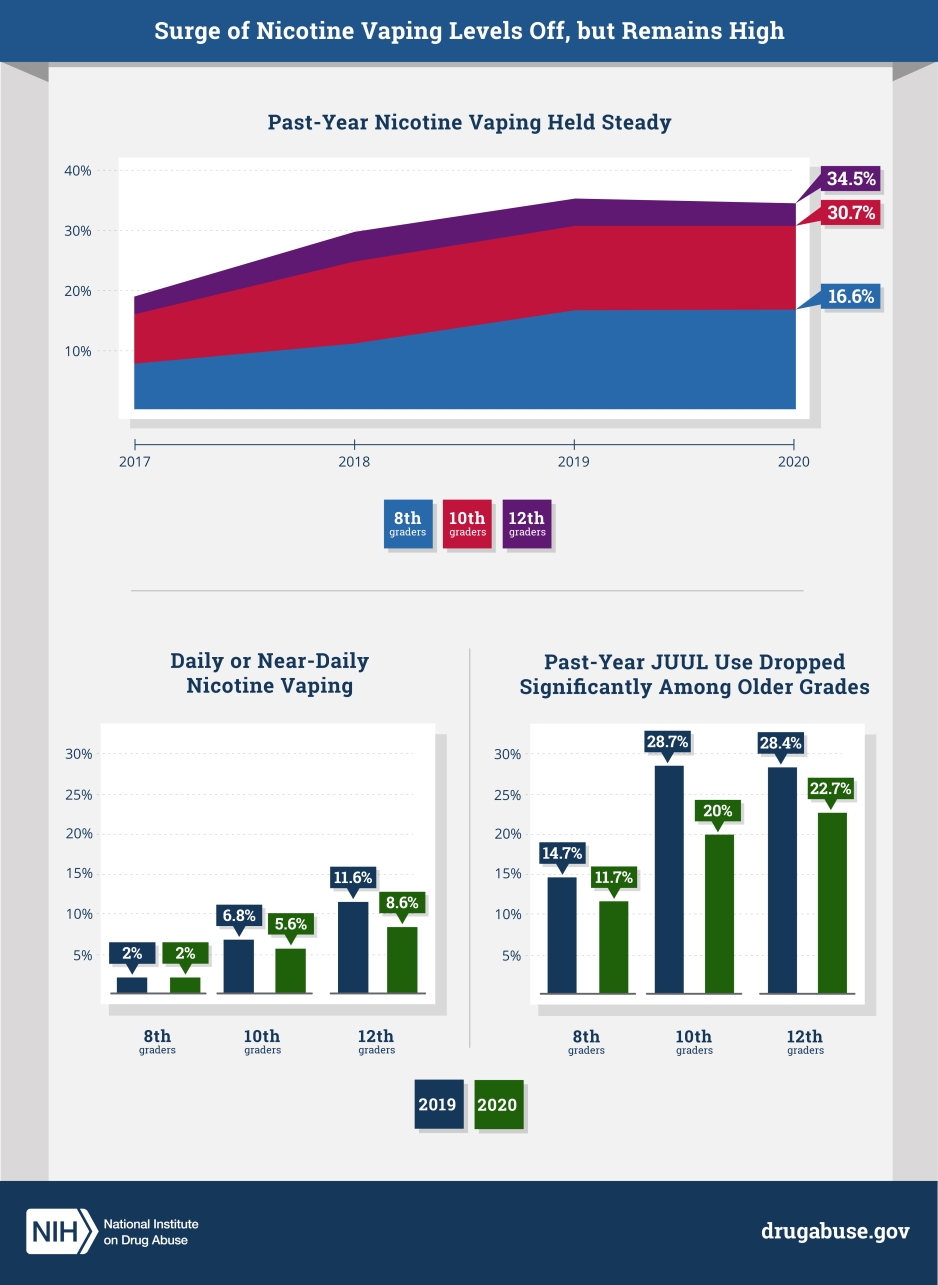
Section: Surge of Nicotine Vaping Levels Off, but Remains High
| 2017 | 2018 | 2019 | 2020 | |
|---|---|---|---|---|
| 8th graders | 7.5% | 10.9% | 16.5% | 16.6% |
| 10th graders | 15.8% | 24.7% | 30.7% | 30.7% |
| 12th graders | 18.8% | 29.7% | 35.3% | 34.5% |
| 2019 | 2020 | |
|---|---|---|
| 8th graders | 2% | 2% |
| 10th graders | 6.8% | 5.6% |
| 12th graders | 11.6% | 8.3% |
| 2019 | 2020 | |
|---|---|---|
| 8th graders | 14.7% | 11.7% |
| 10th graders | 28.7% | 20% |
| 12th graders | 28.4% | 22.7% |
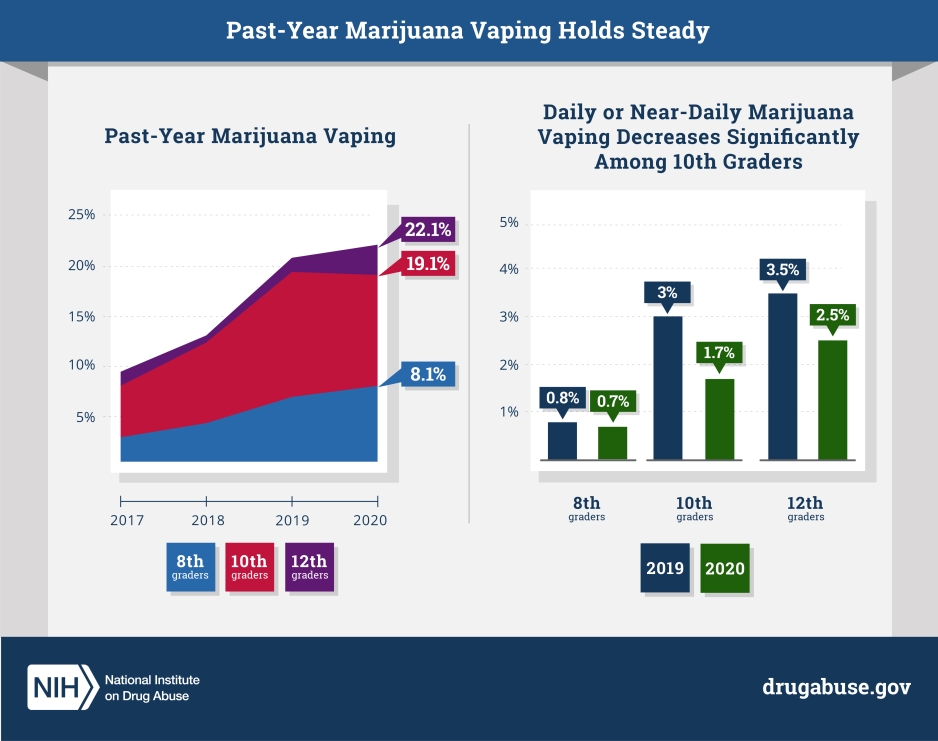
Section: Past-Year Marijuana Vaping Holds Steady, Daily Use Decreases
| 2019 | 2020 | |
|---|---|---|
| 8th graders | 7.0% | 8.1% |
| 10th graders | 19.4% | 19.1% |
| 12th graders | 20.8% | 22.1% |
| 2019 | 2020 | |
|---|---|---|
| 8th graders | 0.8% | 0.7% |
| 10th graders | 3.0% | 1.7% |
| 12th graders | 3.5% | 2.5% |
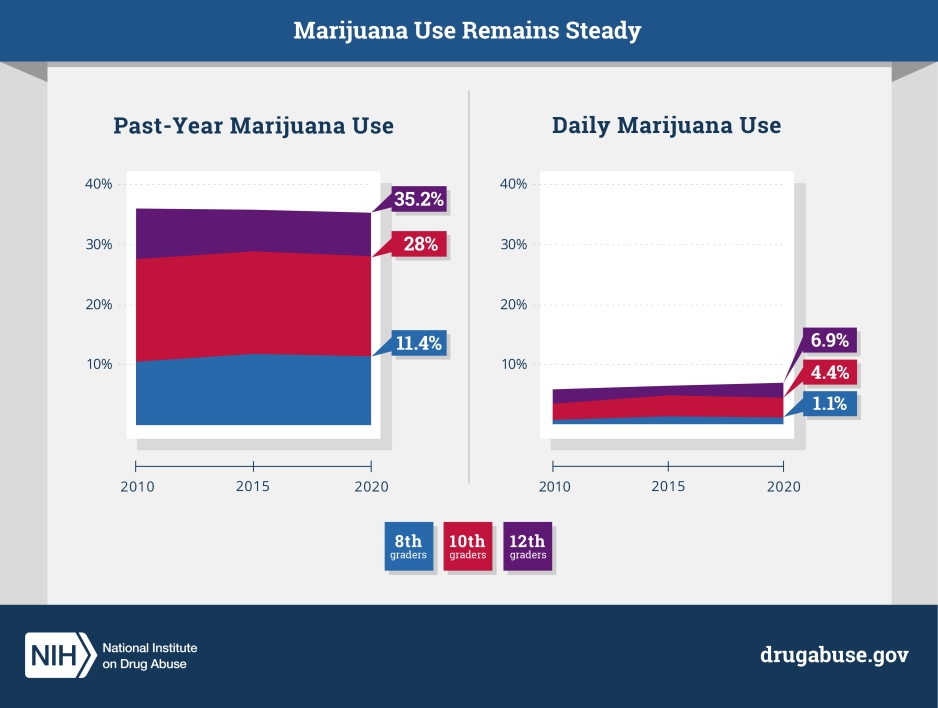
Section: Marijuana Use Remains Steady
Since 2018, both past-year and daily marijuana use remained nearly the same across all age groups.
| 2018 | 2019 | 2020 | |
|---|---|---|---|
| 8th graders | 10.5% | 11.8% | 11.4% |
| 10th graders | 27.5% | 28.8% | 28% |
| 12th graders | 35.9% | 35.7% | 35.2% |
| 2018 | 2019 | 2020 | |
|---|---|---|---|
| 8th graders | 0.7% | 1.3% | 1.1% |
| 10th graders | 3.4% | 4.8% | 4.4% |
| 12th graders | 5.8% | 6.4% | 6.9% |
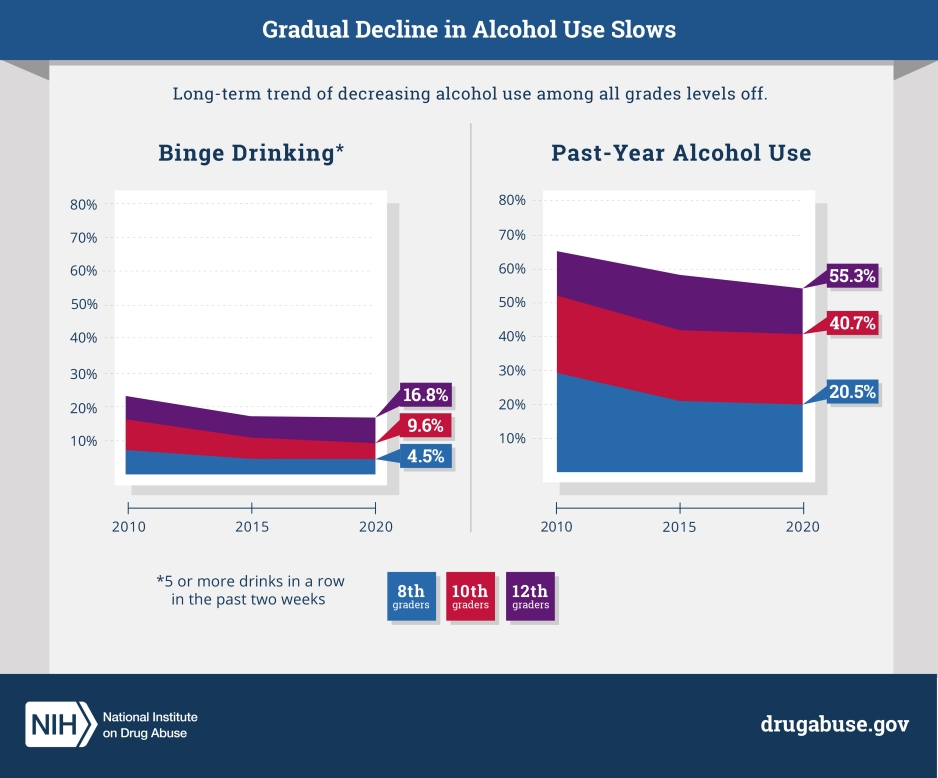
Section: Gradual Decline in Alcohol Use Slows
Over the past 10 years alcohol use gradually declined across all grades. However, the long-term trend leveled off in 2020.
| 2010 | 2015 | 2020 | |
|---|---|---|---|
| 8th graders | 7.2% | 4.6% | 4.5% |
| 10th graders | 16.3% | 10.9% | 9.6% |
| 12th graders | 23.2% | 17.2% | 16.8% |
| 2010 | 2015 | 2020 | |
|---|---|---|---|
| 8th graders | 29.3% | 21.0% | 20.5% |
| 10th graders | 52.1% | 41.9% | 40.7% |
| 12th graders | 65.2% | 58.2% | 55.3% |
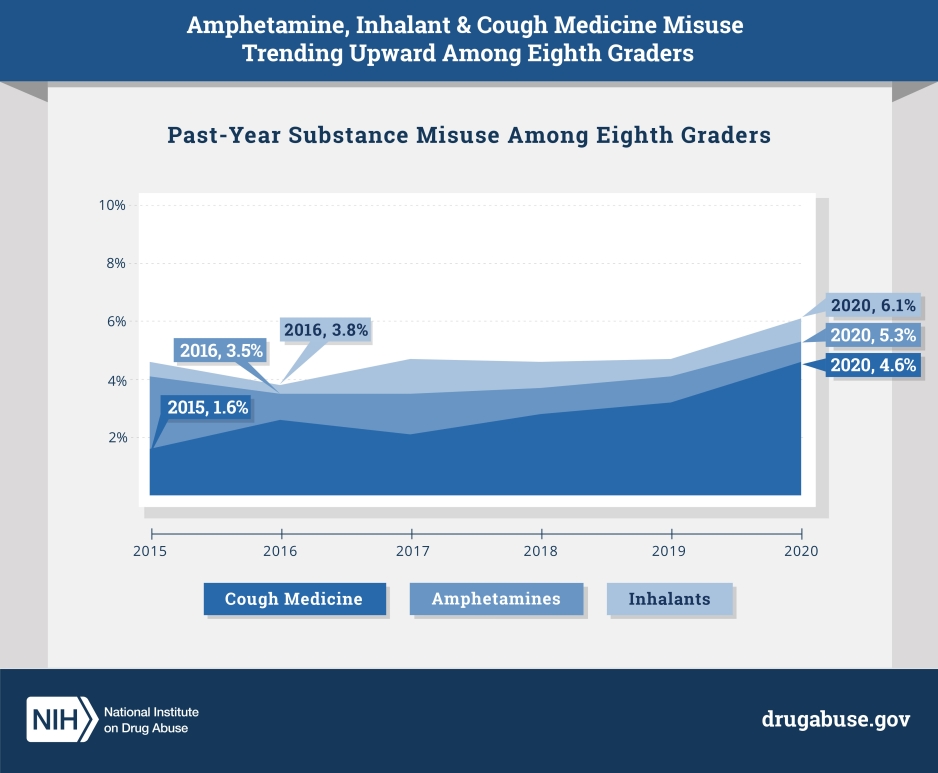
Section: Amphetamine, Inhalant & Cough Medicine Misuse Trending Upward Among Eighth Graders
The percentage of eighth graders who misused amphetamines, inhalants, and cough medicine over the past 12 months continues to gradually increase.
| 2015 | 2016 | 2017 | 2018 | 2019 | 2020 | |
|---|---|---|---|---|---|---|
| Inhalants | 3.8% | 4.7% | 4.6% | 4.7% | 6.1% | |
| Amphetamines | 3.5% | 3.5% | 3.7% | 4.1% | 5.3% | |
| Cough Medicine | 1.6% | 2.6% | 2.1% | 2.8% | 3.2% | 4.6% |
This publication is available for your use and may be reproduced in its entirety without permission from NIDA. Citation of the source is appreciated, using the following language: Source: National Institute on Drug Abuse; National Institutes of Health; U.S. Department of Health and Human Services.

